An exploratory data visualization platform for the Peace Agreements Database (PA-X)
Visualizing temporal, geographic and topical data for peace agreements worldwide, written from 1990 through 2015
For the Political Settlements Research Programme at the University of Edinburgh
DATA ANALYSIS | INTERDISCIPLINARY COLLABORATION | DATA VISUALIZATION | WEB DEVELOPMENT | WRITING
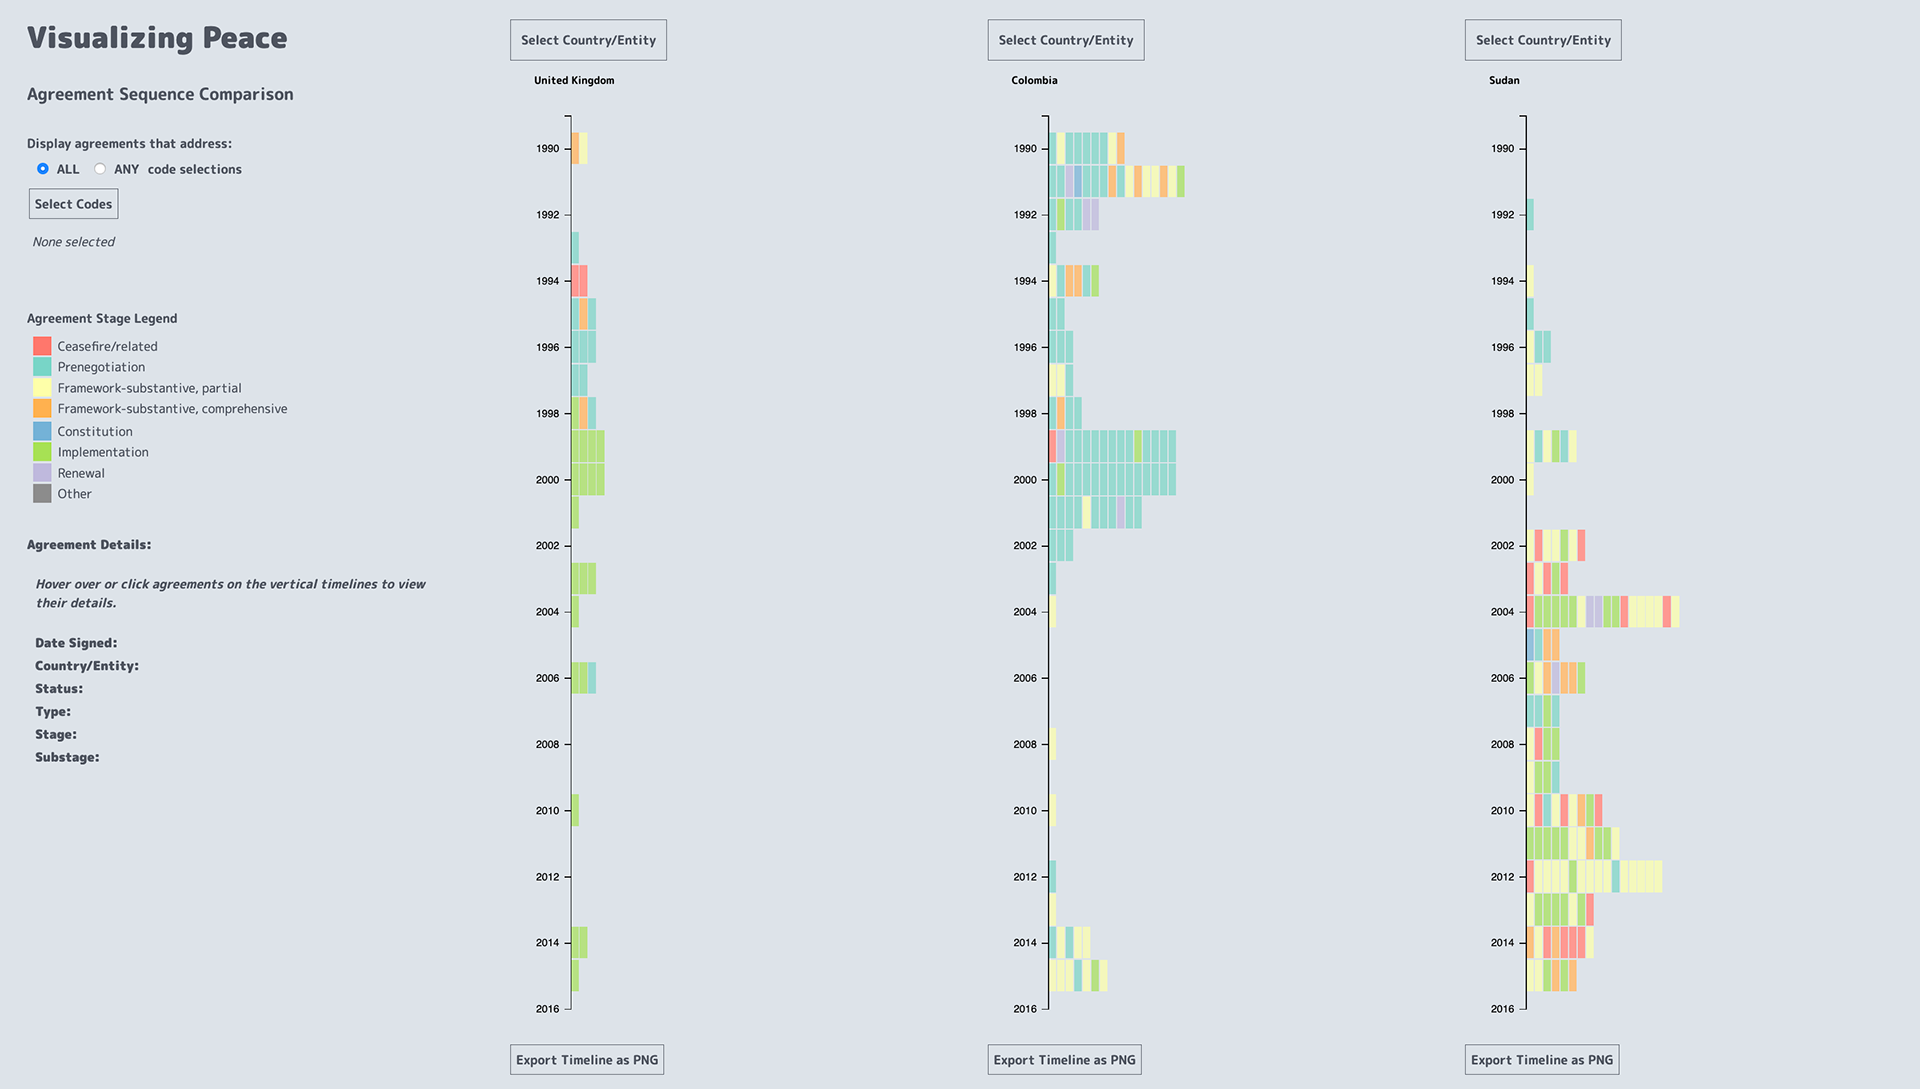
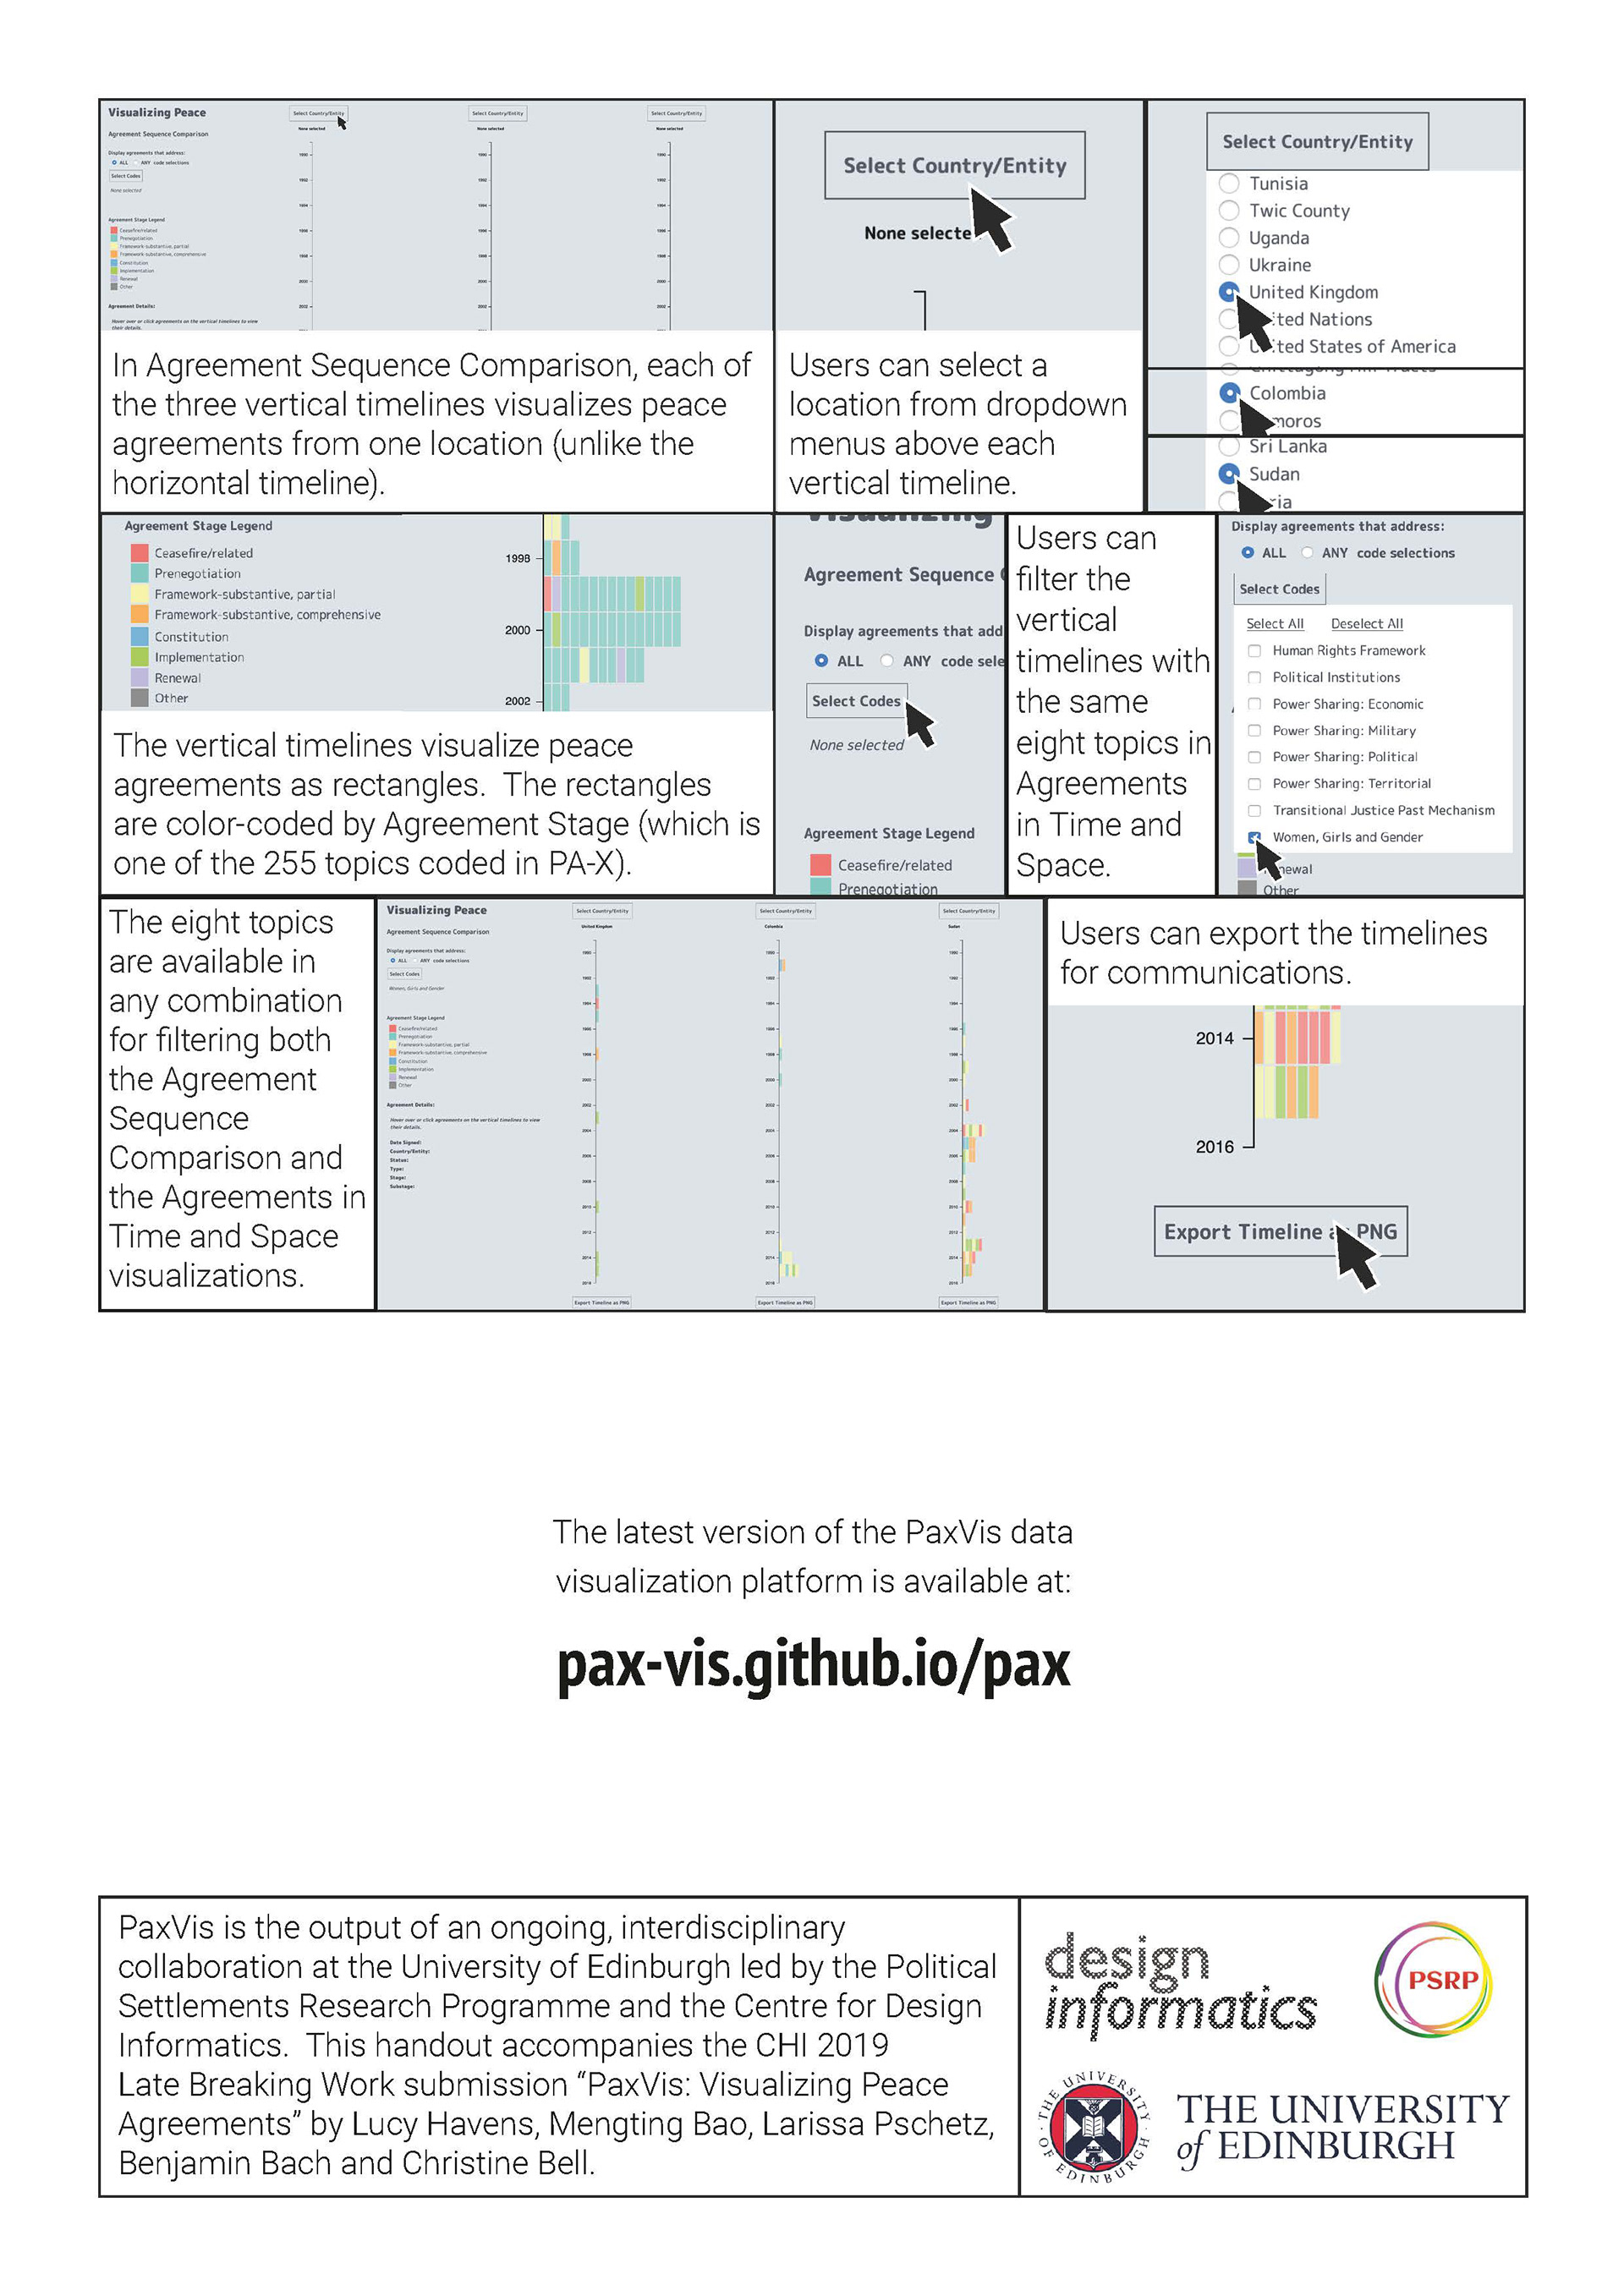
The "Agreement Sequence Comparison" PaxVis data visualization
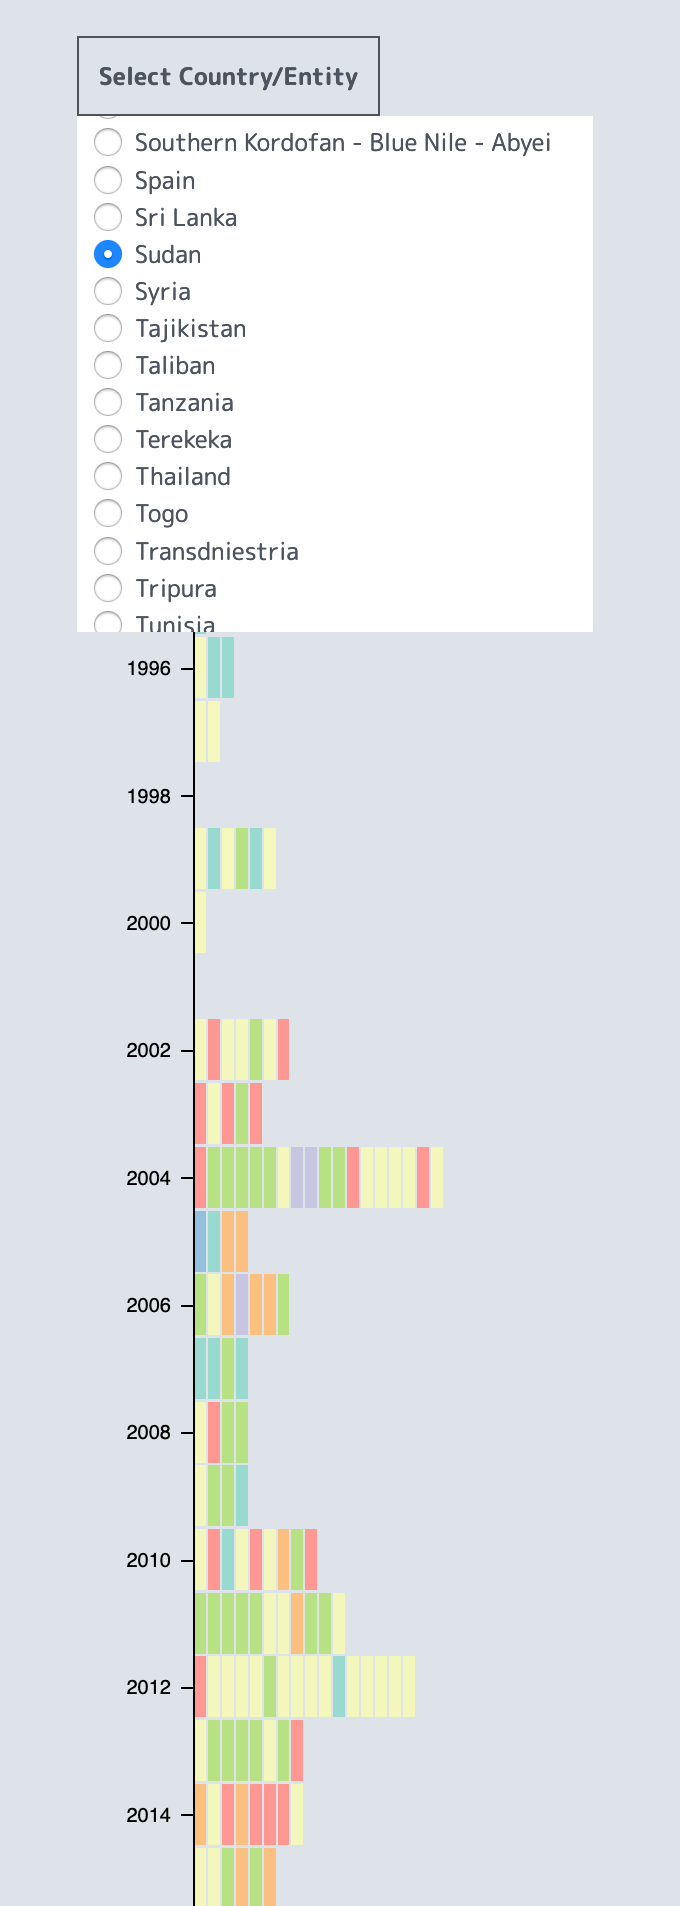
Each vertical timeline visualizes peace agreements from a user-chosen location
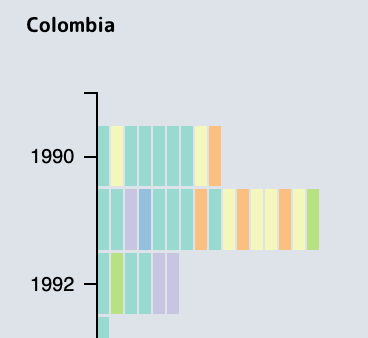
Peace agreements are visualized as rectangles, color-coded by agreement stage
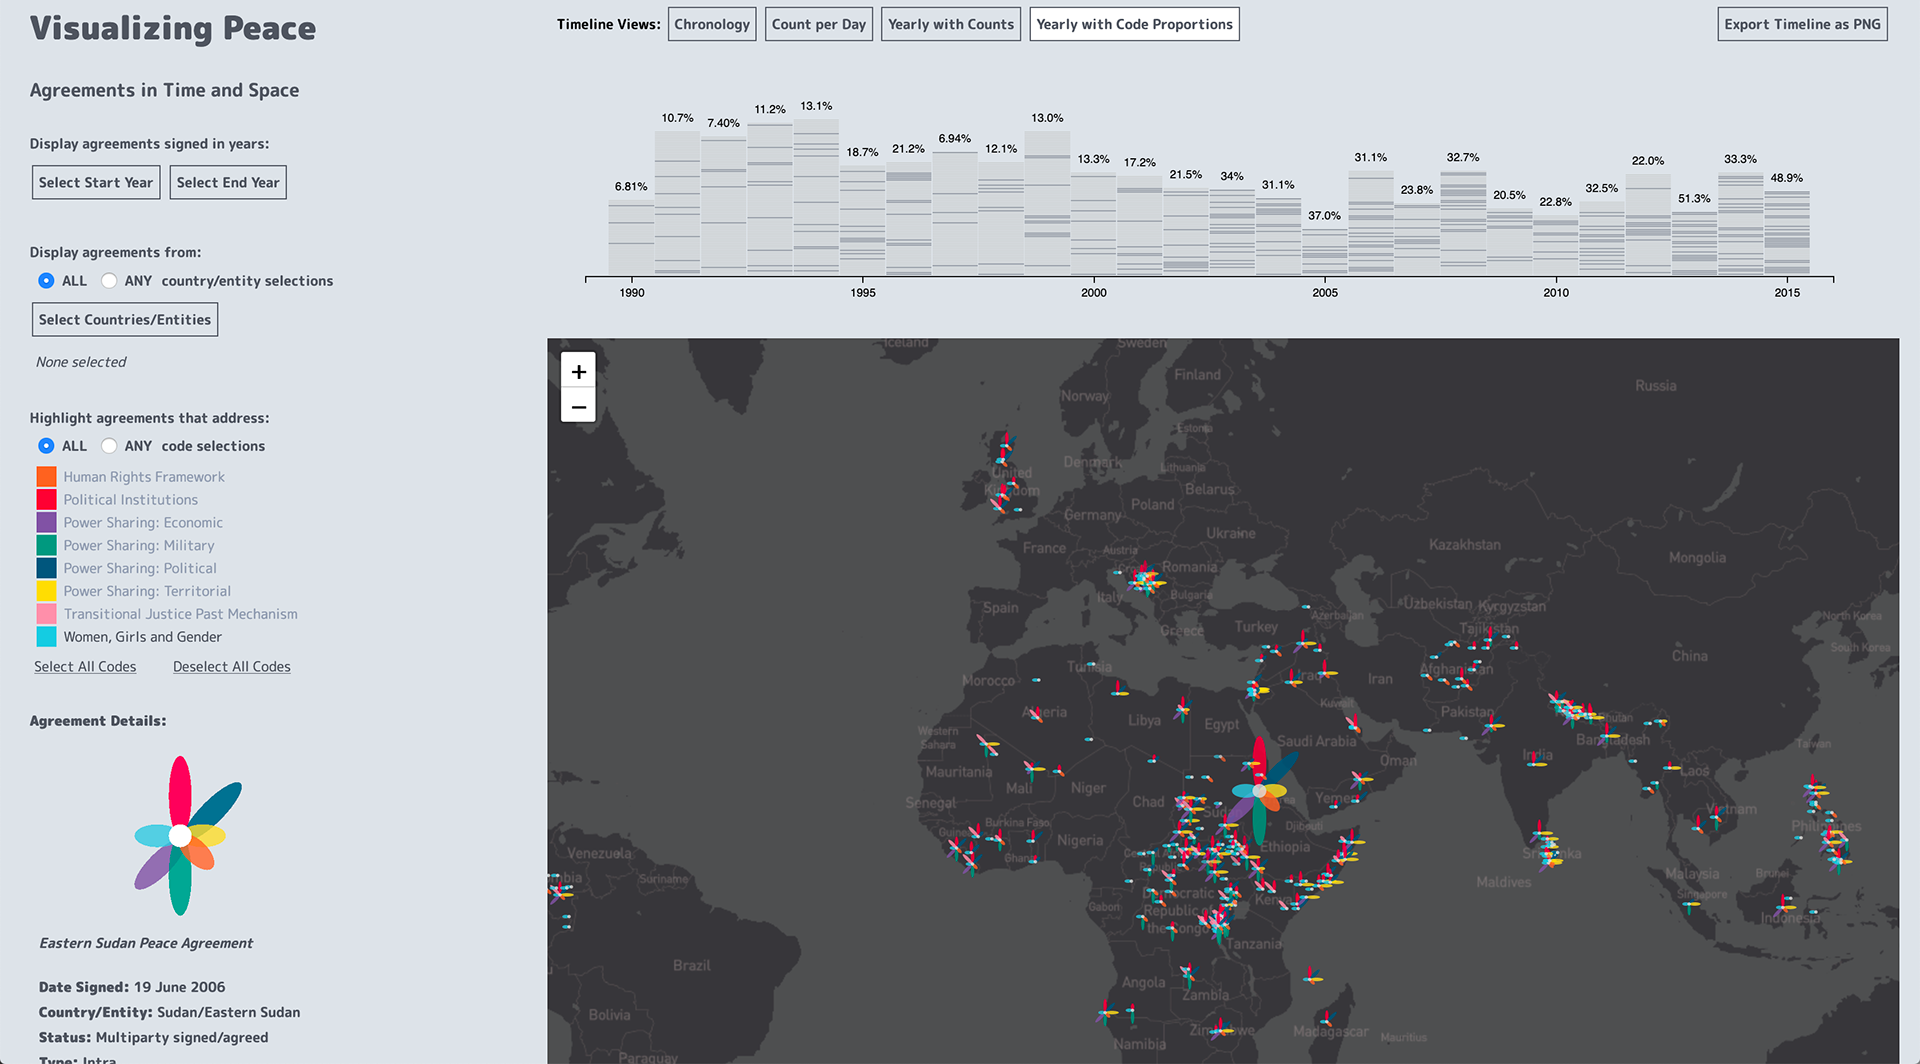
The "Agreements in Time and Space" PaxVis data visualization
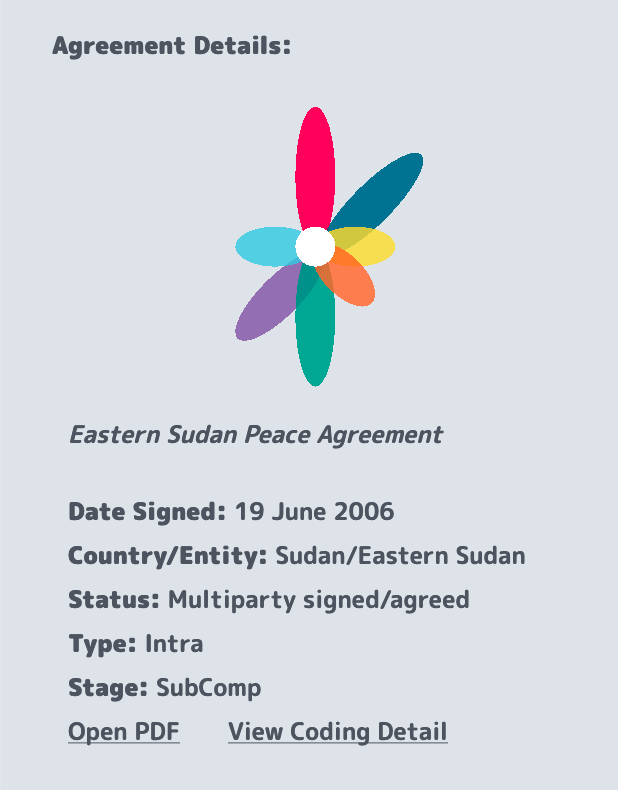
Close up of the details of a peace agreement clicked on the map
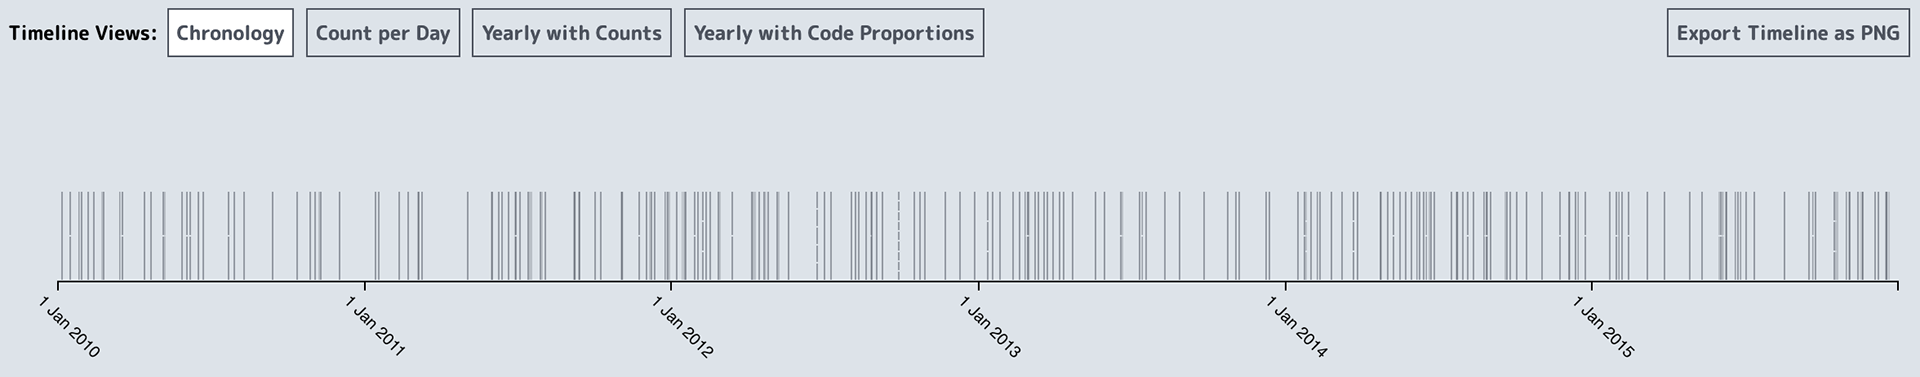
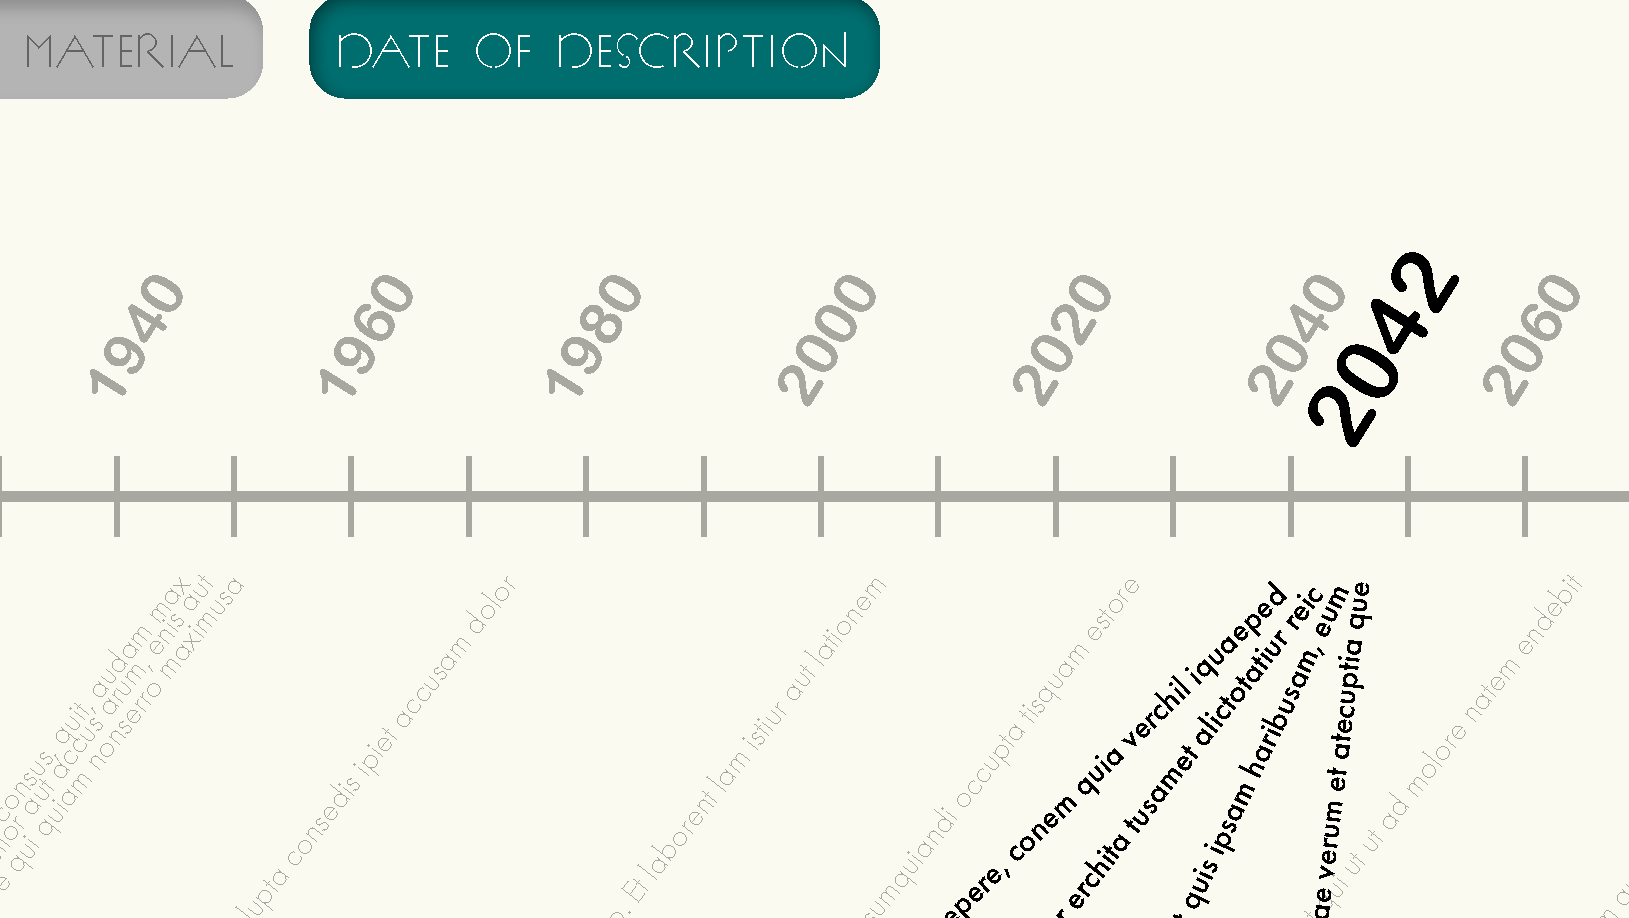
Close up of the horizontal timeline visualizing peace agreements by date, filtered to display agreements written from 2010 to 2015
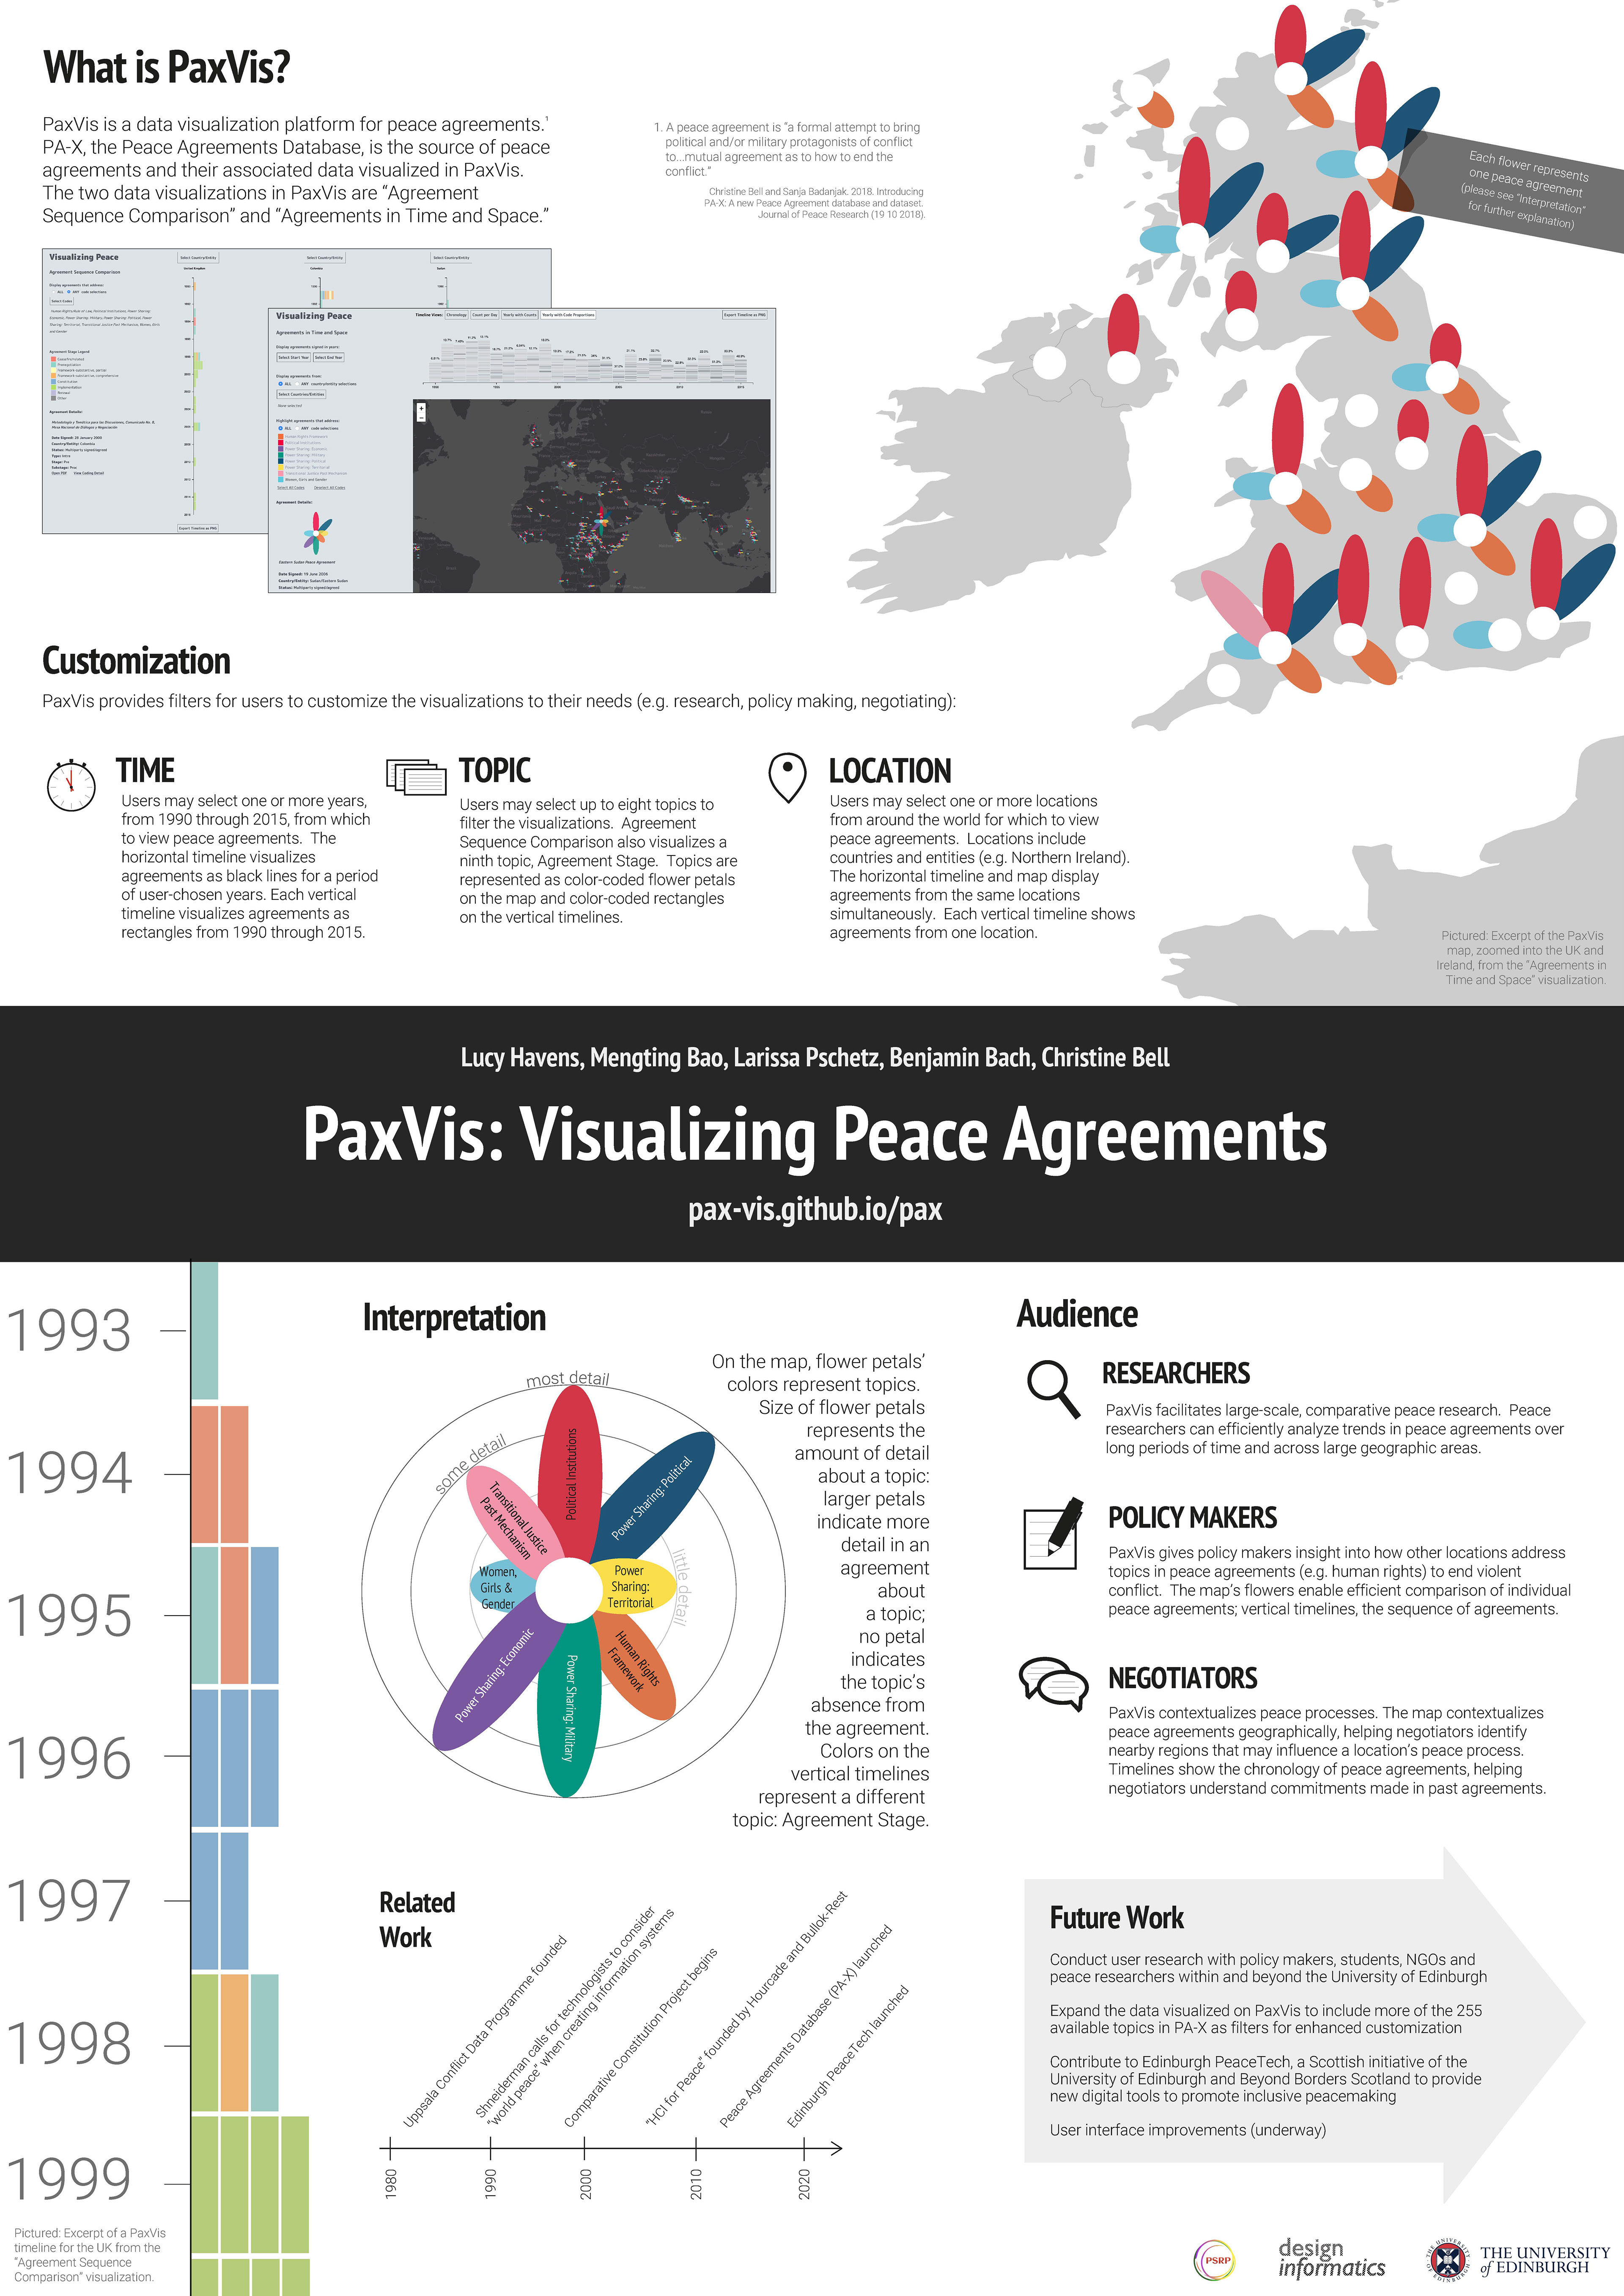
Poster presented at CHI 2019, an annual Human-Computer Interaction conference

Page 1 of the handout for CHI 2019
Page 2 of the handout for CHI 2019
PaxVis was presented at CHI 2019, an annual conference for research in the field of Human-Computer Interaction.
PaxVis Documentation: three blogs written about the project's progress
Created with D3.js and Mapbox